General Sampling Considerations
The right sample size is crucial for meeting survey objectives and for calculating costs. Sample size calculations depend on a number of factors, and it is worth investing time to consider the advantages and disadvantages of different scenarios. Individuals with sampling expertise should either be part of the Technical committee or consulted to check that the proposed sample size will meet the survey’s objectives.
If the survey is intended to measure many indicators among different population groups, a choice must be made as to which indicator will drive the sample size. The major factors that influence sample size decisions are related to the survey purpose and design (see Module 4: Survey design), and include:
- stratification and proposed number of survey strata;
- key indicators, population groups of interest, and whether estimates are required at the stratum or national level;
- precision and level of statistical confidence required for the indicator of interest in the specific population group at the stratum and national levels; and
- available budget.
Each of these four factors will influence decisions about sample size in different ways.
1. Stratification and proposed number of survey strata
- The sample size calculation should initially be based on desired strata-level precision for the indicator and population group. The national sample size is the sum of the strata specific sample sizes.
- In some cases, stratified data are collected for certain indicators, while feasibility issues may mean that only national estimates, or estimates for more than one stratum combined, are collected for other indicators. Feasibility may be limited by the magnitude of the calculated sample size or by factors such as laboratory costs for analysing sufficient samples to obtain reliable estimates at the stratum level.
2. Key indicators, population groups of interest, and whether estimates are required at the stratum or national level
- In cases where the principal aim of the survey is to obtain stratified data for one key indicator, the survey sample size may be based on the calculated sample size for this indicator in the main population group of interest. For example, it may be decided that due to the implementation of an oil fortification programme, vitamin A deficiency is the driving micronutrient of interest. Sample size for this key indicator is then determined largely by:
- the level of stratification
- the desired precision for the estimate
- the expected survey design effect on the indicator.
- If the survey objectives include more than one key indicator, or measurements of a key indicator in different population groups, the stratum-level sample size requirements should be calculated for each indicator for each population group separately. The resulting sample sizes should then be considered against the feasibility of obtaining these sample sizes at the stratum or national level. Box 5.1 presents an example of sample size calculations for several key indicators and for more than one population group of interest. It also includes discussion about the feasibility of obtaining estimates at the stratum and national levels.
3. Precision and level of statistical confidence around point estimates required for the indicator of interest in the specific population group at the stratum and national levels.
- The reason for including a specific indicator will help determine how precise or reliable the indicator measurement needs to be. For example, if a micronutrient indicator is being measured to obtain an initial estimate of the prevalence of deficiency, lower precision may be acceptable. If it is being measured to assess the impact of a targeted intervention, higher precision may be needed to assess the change in prevalence.
- A balance needs to be found between acceptable precision, logistics and cost. Box 5.1 includes discussion of this for the example presented. In general, micronutrient surveys are conducted to provide estimates with programmatically applicable precision, as opposed to research-level precision. For a stratified survey, having good precision at a sub-national level will lead to a more precise national estimate.
- The confidence level describes the confidence interval (CI) around the measurement derived from the survey. The CI is presented as a range of values within which the true value is likely to fall. A 95% CI is used as the standard in most surveys, and is used in the sample size calculations in this module. The width of the CI around the estimate, for example ± 0.05 (± 5%) or ± 0.10 (± 10%) is a measure of the level of precision. For example, if the prevalence of iron deficiency was estimated to be 40% among women of reproductive age, a precision of ±10% would provide 95% confidence limits that range between 30% and 50%. This means that one can state with 95% confidence that the prevalence in the population lies somewhere between 30% and 50%. Whether this is an acceptable level of precision depends on the expected use of the survey results.
- Precision is affected by a number of features, including the design effect for each indicator. Further information about precision and the design effect, as well as about how these are affected by the balance between number and size of clusters, is provided in later sections of this module.
Box 5.1. Sample size estimates for multiple indicators across a single stratum (based on household survey design)
Nutrition-related measure of interest Indicator Population group Precision Estimated prevalence (%) a Estimated design effect b Required sample size c Number of individuals needed to achieve target sample size c Number of households needed to obtain target sample size d Stunting Height/length Children under 5 years ± 7 40 1.5 280 370 530 Anaemia Haemoglobin Children 6-59 months ± 10 45 2 190 235 430 Anaemia Haemoglobin Women 15-49 years ± 10 30 2 160 190 165 Iron Deficiency Ferritin Children 6-59 months ± 10 50 2 192 240 430 Iron Deficiency Ferritin Women 15-49 years ± 10 50 2 192 225 195 Household coverage of adequately iodized salt Household salt iodine level Household ± 10 60 3 280 300 300 a An estimated prevalence of 50% will give the largest required sample size if all other factors remain the same. Therefore, for an indicator with no information on estimated prevalence, 50% is generally used to ensure an adequate sample size.
b Design effect estimated based on previous surveys, estimates from other countries, and knowledge from the national (iodized) salt supply system.
c The formulae used to calculate the (rounded) target sample size and number of individuals needed to achieve this sample size (accounting for expected response rates) are described in later sections of this module.
d This column applies where the survey is designed based on a random selection of households from a complete household listing in each cluster, and takes into consideration the expected proportion of household members within each population group. However, not all surveys are designed in this way. In some cases, a census of households is conducted in advance, and then only households with, for example, children under 5 years of age are visited to obtain the required sample size for this population.
4. Available budget
- Sample size is the principal factor for the total cost of both fieldwork and sample analysis. Therefore, the sample design, sample size, and available budget need to be considered together.
The interplay between these factors and their effect on sample size is illustrated in Figure 5.1.
Other factors to consider in calculating a sample size include:
- Finite population correction (FPC) factor:
- Most cluster survey sample size formulae assume an infinite or very large number of PSUs in the geographic area of interest. If the total number of PSUs is “small,” as may be the case in some Pacific Island nations, for example, a smaller sample size can be used by taking into consideration the FPC factor. There is no exact value for what makes a “small” target population, but in general the FPC factor is considered when the total number of PSUs from which the sample is selected is less than 1000. For geographic areas with at least 1000 PSUs, the FPC factor will not substantially change the sample size and is very rarely used.
- Response rate:
- In calculating the sample size, an estimate of the response rate is needed, and the sample size needs to be increased to account for non-response. For household surveys that include individual-level indicators, there are two levels of response: the household-level response and, for participating households, the individual response.
Fig. 5.1. Factors affecting sample size
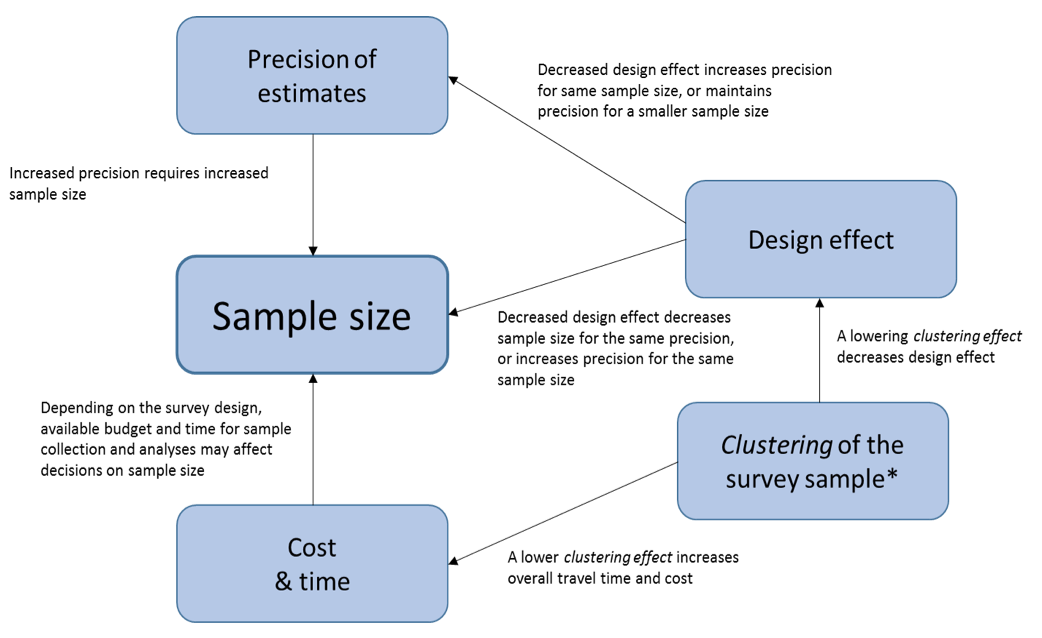 *The clustering effect can be lowered by increasing the number of clusters and decreasing the number of samples per cluster. The concept of clustering effect is described in later sections of this module.
Weighting stratified surveys
Instructions on how to calculate weights for stratified surveys
Download