How to segment primary sampling units (PSUs)
Selected PSUs can be made up of one single or multiple clusters. PSUs may vary widely in the number of households or population size. It would not be cost- or time-efficient to conduct a full listing of all households in large PSUs. Instead, it would be more useful to subdivide them into smaller geographic areas, called segments (sometimes referred to as quadrants). Only one of these segments will be selected as the cluster eligible for sampling, then it will be mapped and listed. Box 7.1 presents the main rationale for PSU segmentation.
Box 7.1. Rationale for PSU Segmentation
Large PSUs may need to be segmented to accommodate numerous clusters within a single PSU (an example is provided in Box 5.1). When PSUs are split into discrete segments, it is important to adopt segment boundaries that are easily identifiable. If clearly identifiable boundaries are not present, it may not be appropriate to subdivide the area.
Segmentation of large PSUs into multiple clusters is also advantageous for survey logistics. A micronutrient survey generally requires the transport of a large amount of equipment, for conducting anthropometric measurements and for collecting and storing samples and specimens. In some surveys, a central laboratory is set up in each cluster, and eligible participants are asked to go to this location for measurement and for collection of samples or specimens. It therefore makes sense to have smaller cluster sizes. Ideally the cluster should not contain more than three to five times the number of households that need to be selected. Thus, if 30 households are needed, a range of 90–150 households in the cluster is ideal. Larger clusters will have more variation in outcomes, increasing the intra-cluster correlation and the design effect.
Upon arrival in a large PSU that may need segmentation, the listing team should first tour the PSU and do a quick count to estimate the number of households. In general, any PSU with well over 100 households should be subdivided into segments of approximately equal size, ideally around 90-150 households each.
Each listing team should have segmentation forms available to them in the field. These may be paper or electronic forms. Instructions and examples of forms are provided in the Mapping household listing and segmentation online tool. Segmentation and selection of a sample segment will be carried out as described in Box 7.2.
Box 7.2. How to segment and select a sample segment
- Draw a location map of the entire PSU (see Fig. 7.1).
- Conduct a quick approximate count of the number of dwellings in the whole area. Where there are large multi-dwelling structures that are likely to include many households, such as an apartment block, information should be obtained about the likely number of households in the structure.
- Using clear boundaries, such as roads, paths, or streams, divide the PSU into segments that contain roughly equal numbers of dwellings. There may be considerable differences in geographic size between segments, depending on population density.
- Indicate the boundaries of the newly created segments on the location map.
- Number the segments sequentially.
- For each segment, do a quick approximate count of the number of dwellings and likely number of households.
- If the segment is still too large (well over 100 households), then divide it further into smaller areas, called sub-segments.
- Using the “Mapping household listing and segmentation” online form, record the PSU number and locality, and indicate the number of dwellings, percentage and cumulative percentage per segment in the appropriate columns.
- Using a random number table or generator, select a random number between 1 and the total number of segments. A Random number table is available in the online tools.
- Select the segment with this number as the cluster to be surveyed.
- Draw a full sketch map of the selected segment and list all the households found (see Fig. 7.2); a sample listing form is available in the Household Listing online tool.
- Select households using a systematic random process (SRS) described in Module 4: Survey design.
For the purpose of segmenting a cluster, the initial count of households does not have to be precise. A close approximate count of dwellings and likely number of households is sufficient. It is acceptable to have a slightly unequal number of households per segment in order to create segments with clearly identifiable boundaries.
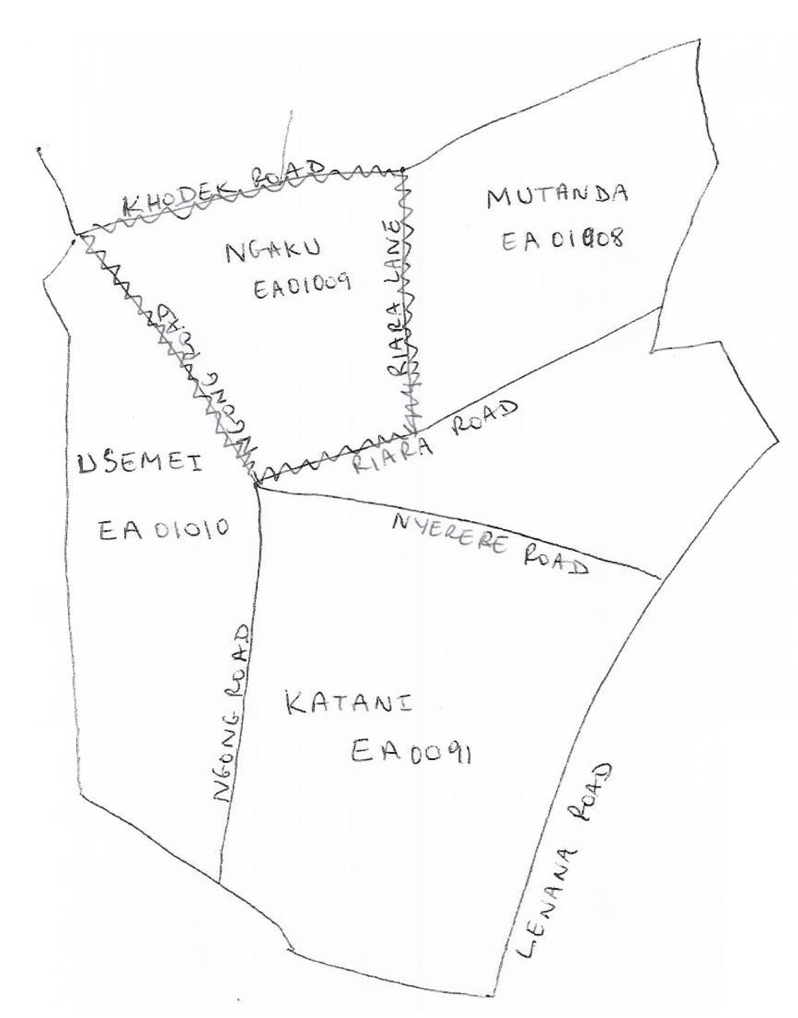
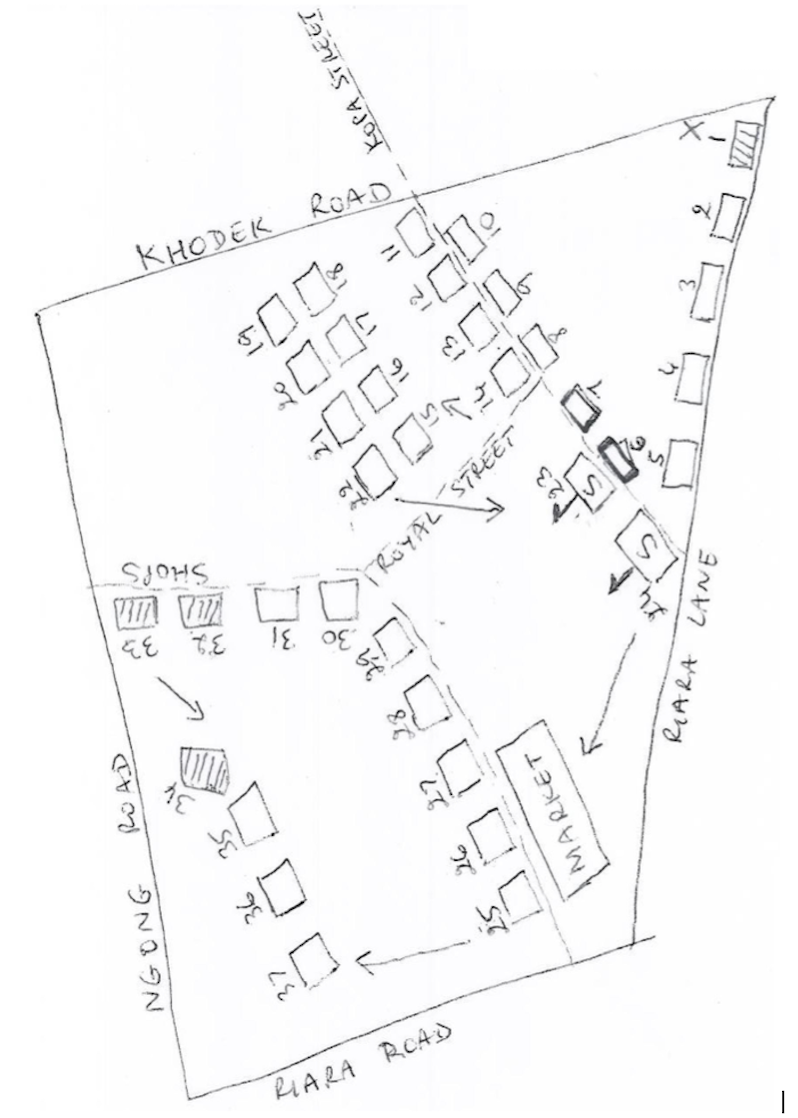
Fig. 7.1 shows an example of a cluster location map, while Fig. 7.2 shows a detailed sketch map of the cluster.
Fig. 7.1. Example map showing the location of the selected cluster Ngaku, Code EA01009a
a MICS manual for mapping and household listing (25 February 2019). New York: United Nations Children’s Fund; 2019 (http://mics.unicef.org/files?job=W1siZiIsIjIwMTkvMDIvMjYvMTkvMzEvMzAvOTU5L01JQ1NfTWFudWFsX2Zvcl9NYXBwaW5nX2FuZF9Ib3VzZWhvbGRfTGlzdGluZ18yMDE5MDIyNS56aXAiXV0&sha=1822015d5f32e1e5; accessed 17 June 2020).
Fig. 7.2. Sketch map showing structures within cluster Ngaku, Code EA01009 a
a MICS manual for mapping and household listing (25 February 2019). New York: United Nations Children’s Fund; 2019 (http://mics.unicef.org/files?job=W1siZiIsIjIwMTkvMDIvMjYvMTkvMzEvMzAvOTU5L01JQ1NfTWFudWFsX2Zvcl9NYXBwaW5nX2FuZF9Ib3VzZWhvbGRfTGlzdGluZ18yMDE5MDIyNS56aXAiXV0&sha=1822015d5f32e1e5; accessed 17 June 2020).
Segmenting urban areas may be easier than segmenting rural areas. Cities and towns are usually organized into blocks or other similar units. When using census enumeration areas (EAs) in cities and larger towns, maps are often available that show streets and blocks. If they are not available, such maps can be easily drawn. A quick drive through the area will provide a sense of whether there are an approximately equal number of dwellings of similar size per block. If so, the cluster could be segmented by block or parts of blocks.
For example, in an urban PSU that includes 18 very similar blocks, where the number of dwellings per block would also be expected to be similar, estimate the number of dwellings per block. If each block contains approximately 50 dwellings, the total number would be 900. This could be divided to give seven segments of approximately 125 dwellings (or 2.5 blocks) per segment. If the number of dwellings per block or the expected number of households per dwelling varies considerably, the number in each would need to be estimated before dividing into approximately equal segments.
In rural areas, it is likely that several households may exist in the same compound and that the number in each compound may need to be estimated. Large clusters, such as cities, may already have political subdivisions with an estimated number of households or population size. These can be used to define segments.
Fig. 7.3 illustrates the standard decisions and steps to take depending on the original PSU size. In this example, it is assumed that the average household size is 7.4 individuals, the number of households to be assessed is 30, and the goal is to identify a segment with approximately 100 households (in other words, a segment with around three times the number of households that will be included in the sample).
There are several advantages and disadvantages to be weighed in determining the segment size. For example, if households are selected systematically over a large area, the amount of time required for the teams to get from one household to the next may make supervision more difficult. However, if a cluster size is very small, the diversity of the selected sample is reduced and the design effect (DEFF) is increased.
- If the number of households in the PSU is not known, but an estimate of the population size is available, then this information can be used to determine the expected number of segments required, based on the average household size in the country and the desired number of households per segment. For example, if there is an average of 7.4 persons per household, and the aim is to identify segments of around 100 households, then the expected total population of these households would be 740. If it is known that the PSU has a population of approximately 1350, the number of segments would be:
-
1350 ÷ 740 = 1.8 (this will be rounded up to 2)
In this example, the PSU should be divided into two segments of approximately equal size, one of which should be randomly selected and its households listed.
If the total estimated population of the PSU is less than 450, segmentation is not usually necessary unless the average household size is below 2.5, equivalent to approximately 180 households. It should be possible to count the total number of households in a PSU that has fewer than 150 households and select the required number of households to be surveyed.
Fig. 7.3. Example of PSU size (number of households or population size) and approaches to determining the segment to be surveyed a
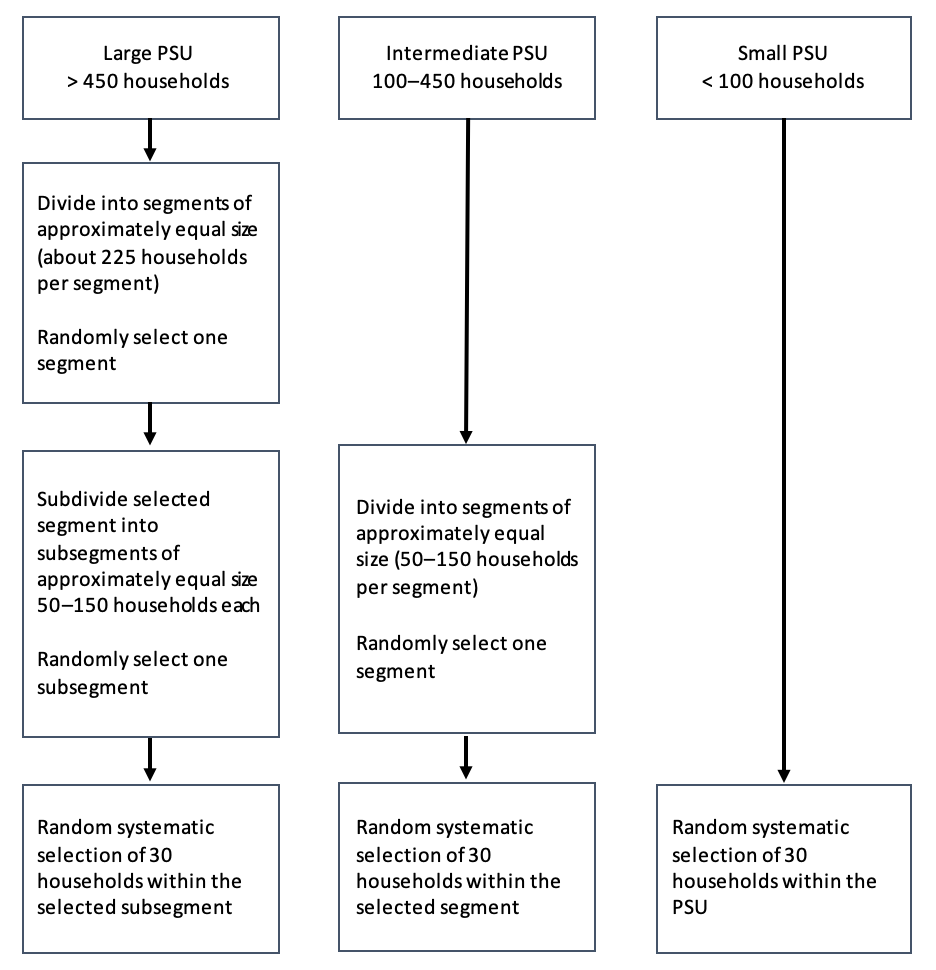
a This example assumes that 30 households are to be selected in each cluster and that there are approximately 7.4 individuals per household.